
How does British weather affect your vitamin D levels?
We’ve analysed the data of 71,789 customers. Find out the average vitamin D level in your area and why you should consider a supplement this winter.

Ever wondered where the sunniest place in the UK is? You’d be forgiven for suggesting Cornwall, but recently, it’s the south and southeast coast that takes the crown, according to Met Office data [1]. Counties like Dorset, Hampshire, and Sussex soak up around 2,000 hours of sunshine a year, whereas some areas in Scotland get half as much.
We make most of our vitamin D with the help of sunlight, so if you are living in certain areas of the UK that aren’t that sunny, your risk of vitamin D deficiency is greater. We look at this in more detail, as well as other factors that may put you at risk.
In this article, we look at:
- What is vitamin D?
- What’s the current guidance on vitamin D?
- What’s the average vitamin D level in your area of the UK?
- How do the seasons affect vitamin D levels?
- What else affects vitamin D levels?
What is vitamin D?
Vitamin D is a fat-soluble vitamin produced by the body following sunlight exposure. We also get some from our diet. Vitamin D is technically a hormone that contributes to immunity and regulates calcium levels in the body, important for bone, muscle, and joint health.
A lack of vitamin D can lead to:
- Fatigue
- Softer bones (osteomalacia) and bone pain
- Muscles weakness
- Low mood
- Poor wound healing
- Hair loss
Find out more about vitamin D and its function.
What is the current guidance on vitamin D?
Nearly half of adults are unaware of vitamin D supplement recommendations, and more than half don’t take supplements or take them inconsistently [2].
So, what’s the advice?
Everyone should consider taking a daily 10 microgram vitamin D supplement during autumn and winter. If you’re in a higher-risk group for vitamin D deficiency, you’re better off taking a supplement all year round [3].
You’re at greater risk for vitamin D deficiency if you:
- are not often outdoors
- are in a care home or other institution
- usually wear clothes that cover up most of the skin
- have dark skin
What level of vitamin D is optimal?
There is currently no agreed consensus on an optimal level of vitamin D. Some scientists suggest that levels above 50 nmol/L (20 ng/ml) are sufficient, while 70–80 nmol/L (28–32 ng/ml) is likely optimal for general health [4–6].
For specific conditions — including COVID-19, breast cancer, and diabetes — optimal vitamin D levels have been quoted as high as 100–125 nmol/L (40–50 ng/ml), but these are based on weaker evidence [7].
You can check your vitamin D levels at home with our Vitamin D (25 OH) Blood Test. This simple finger-prick test comes with an explanation of your result to determine the next best steps.
What’s the average vitamin D level in your area of the UK?
With many people not meeting their vitamin D requirements, you might be interested to know that the area you live is likely to play a part.
We analysed the vitamin D levels of 71,789 Medichecks customers over a three-year period, according to the region they live in the UK. And here’s what we found.
People from regions like the South West and South East had the highest levels of vitamin D. There could be any number of reasons for this. These areas:
- Get more annual sunshine
- Have a high number of outdoor jobs and leisure pursuits
- Have an active older population who may spend time outdoors
The one place that did not follow this trend was London. This may reflect the higher proportion of minority ethnic groups with dark skin living in London compared to other parts of England [8] — darker skin is less effective at making vitamin D from sunlight. It also gets less annual sunshine compared with other southern regions, some of which may be due to air pollution. Built-up areas surrounded by tall buildings tend to cast cities mostly in shade too.
Another reason may be due to the work culture in the big city. London's young demographic, high cost of living, and concentration of high-skilled work drive a culture of long working hours. The Health Survey for England 2010 found that 35% of adults in London had low vitamin D levels compared to the national average of 24% [9].
People from areas with less sunshine (and more rain) — like the West Midlands, Northern Ireland, Scotland, and Wales — tend to have lower vitamin D levels. A 2016 report from the Scientific Advisory Committee on Nutrition (SACN) showed that one in six adults in Scotland was vitamin D deficient, even in summer. The same was true for Londoners [10].
According to our data, people’s vitamin D levels in the South West were over 8% higher than those in the West Midlands (71.4 nmol/L versus 66.0 nmol/L).
The maps below show how average vitamin D levels and annual sunshine correlate.
(Note that these results include customers who may or may not supplement with vitamin D.)
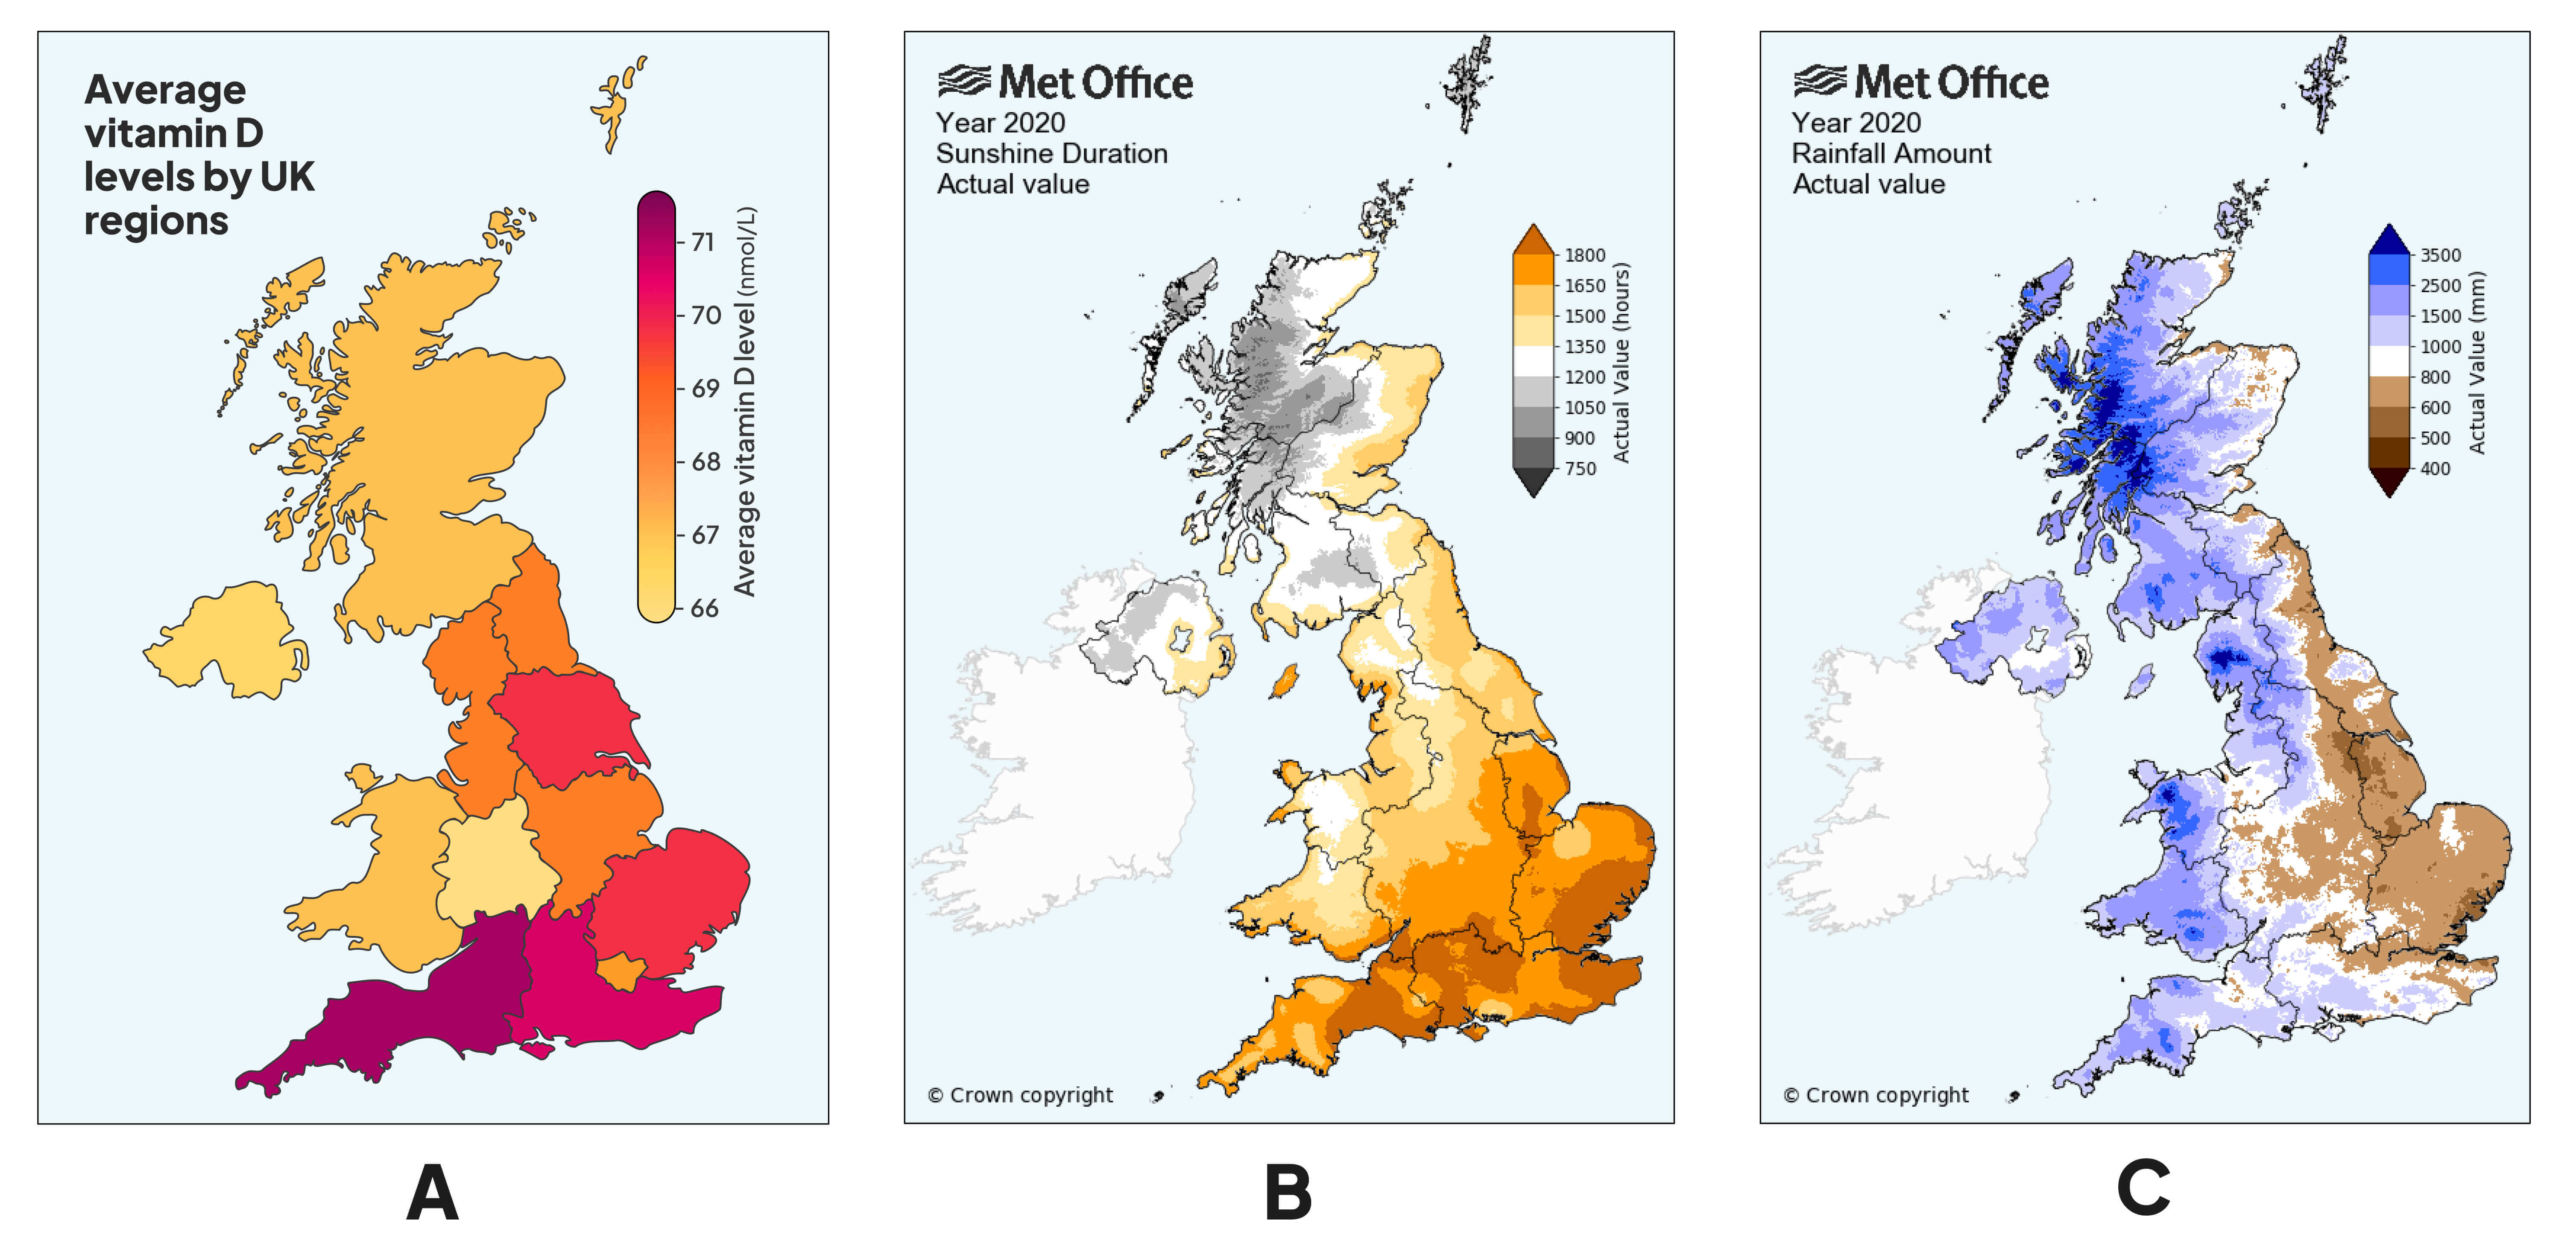
A: Map of the UK showing median vitamin D levels for 71,789 Medichecks customers between 1/1/19 and 31/12/21. Darker regions of the map highlight where average vitamin D levels are highest.
B: Used with permission from Met Office, UK actual and anomaly maps [1]: average annual sunshine duration (hours) in 2020.
C: Used with permission from Met Office, UK actual and anomaly maps [1]: average annual rainfall (mm) in 2020.
How do the seasons affect vitamin D levels?
Throughout autumn and winter, days are shorter, and the cold weather prompts us to spend more time indoors. Most of us, therefore, see a significant drop in vitamin D.
October through to March is when levels reach their lowest, so if you’re a bit hit-and-miss with your supplements, this is the time to make sure you take them.
Collective data from our customers over three years showed that vitamin D levels were lowest in January and highest in August and September. Levels fluctuated by over 15% throughout the year — this is one of the many reasons why in winter, many people may develop symptoms, such as low mood.

In summer, most people can make all the vitamin D they need through sunlight and a balanced diet. So, as long as you’re not in a high-risk group, it’s up to you whether you discontinue your supplement during this time.
What else affects vitamin D levels?
As well as the weather, many other factors can affect your vitamin D levels.
Factors affecting vitamin D levels include:
- Age — the likelihood of vitamin D deficiency may increase with age depending on activity levels and time spent outdoors. The skin generally becomes less efficient at creating vitamin D from sunlight. Frail individuals are particularly at risk as they may spend less time outdoors [11].
- Gender — you’re more likely to have low vitamin D levels if you’re female. Some of this may be explained by the increased risk during pregnancy and breastfeeding [12].
- Skin colour — people with darker skin, such as people of African or South Asian descent, produce vitamin D more slowly when exposed to sunlight, due to higher melanin concentrations. A 2016 health report showed that average vitamin D levels were higher in white adults (45.8 nmol/L) compared to Asian (20.5 nmol/L) and black (27.7 nmol/L) adults [3,10].
- Obesity — vitamin D levels tend to be lower in people who are obese [12,13].
- Smoking — smoking is associated with lower vitamin D levels and it is unclear why [13,14]. Harmful chemicals in cigarette smoke may affect enzyme activity and the production of vitamin D [15].
- Time spent outdoors — people who are housebound or spend little time outdoors are more likely to be deficient in vitamin D (3). Around two in five adults in institutions (e.g. care homes) are vitamin D deficient [10].
- Shift work — shift workers and indoor workers are consistently reported as the occupational group most likely to have lower vitamin D levels as they expose themselves less frequently to direct sunlight [16].
- Chronic disease or malabsorption disorders — conditions like chronic kidney disease and Crohn’s disease are risk factors for low vitamin D due to malabsorption. [17,18].
- Medications — some drugs, such as steroids and anti-epilepsy medication, are likely to lower vitamin D levels [19].
- Clothing — wearing clothing that covers most of the skin when outside will prevent the body from producing as much vitamin D [3].

Can you get vitamin D through a window?
The sun emits UVA, UVB, and UVC rays. UVC rays are the most damaging, but they are filtered by the atmosphere and don’t reach the earth’s surface.
UVB rays are what trigger the body to produce vitamin D, but most glass windows block this wavelength. On the other hand, most UVA rays will travel through ordinary glass, which means it’s still possible to burn through a window, but it’ll take longer than being in direct sunlight.
So, if you’re planning to boost your vitamin D levels by working next to a sunny window, it’s not going to work. You’re best off taking a ten-minute break outdoors.
Enjoying the sun safely
Sun exposure is the main source of vitamin D, but excessive sun exposure is the main cause of skin cancer, including melanoma, the fastest-rising type of cancer in the UK. Unsurprisingly, the risk of melanoma is greatest in the South and South West, where there is more sunshine.
Enjoying the sun safely, whilst taking care not to burn, means you can get your hit of vitamin D whilst keeping your risk of skin cancer low. Consider taking a supplement too, especially over autumn and winter, to prevent deficiency.
You can find out more about vitamin D and vitamin D deficiency in our vitamin D guide.
KEY POINTS
- One in six adults has low vitamin D
- Vitamin D levels naturally fall over autumn and winter
- Areas most at risk of deficiency are the North, Scotland, and Wales
- Everyone in the UK should consider taking vitamin D supplements to prevent deficiency, especially those at higher risk
References
- UK actual and anomaly maps [Internet]. Met Office. [cited 2022 Sep 13]. Available from: https://www.metoffice.gov.uk/research/climate/maps-and-data/uk-actual-and-anomaly-maps
- 49% adults unaware of vitamin D recommendation - British Nutrition Foundation [Internet]. [cited 2022 Sep 20]. Available from: https://www.nutrition.org.uk/news/2021/british-nutrition-foundation-survey-reveals-49-adults-unaware-of-uk-government-guidelines-for-vitamin-d/
- Vitamin D [Internet]. nhs.uk. 2017 [cited 2022 Sep 20]. Available from: https://www.nhs.uk/conditions/vitamins-and-minerals/vitamin-d/
- Pearce SH, Cheetham TD. Diagnosis and management of vitamin D deficiency. BMJ. 2010 Jan 11;340:b5664.
- Bischoff-Ferrari HA, Giovannucci E, Willett WC, Dietrich T, Dawson-Hughes B. Estimation of optimal serum concentrations of 25-hydroxyvitamin D for multiple health outcomes. Am J Clin Nutr. 2006 Jul;84(1):18–28.
- Dawson-Hughes B, Heaney RP, Holick MF, Lips P, Meunier PJ, Vieth R. Estimates of optimal vitamin D status. Osteoporos Int. 2005 Jul;16(7):713–6.
- Grant WB, Al Anouti F, Boucher BJ, Dursun E, Gezen-Ak D, Jude EB, et al. A Narrative Review of the Evidence for Variations in Serum 25-Hydroxyvitamin D Concentration Thresholds for Optimal Health. Nutrients. 2022 Feb 2;14(3):639.
- Overview | Vitamin D: supplement use in specific population groups | Guidance | NICE [Internet]. NICE; [cited 2022 Sep 21]. Available from: https://www.nice.org.uk/guidance/PH56
- Digital NHS. Health Survey for England [Internet]. 2015 [cited 2022 Sep 21]. Available from: https://www.data.gov.uk/dataset/15980404-3b4b-4693-992e-4da3217c2d03/health-survey-for-england
- SACN vitamin D and health report [Internet]. GOV.UK. [cited 2022 Sep 21]. Available from: https://www.gov.uk/government/publications/sacn-vitamin-d-and-health-report
- Gallagher JC. Vitamin D and Aging. Endocrinol Metab Clin North Am. 2013 Jun;42(2):319–32.
- Muscogiuri G, Barrea L, Somma CD, Laudisio D, Salzano C, Pugliese G, et al. Sex Differences of Vitamin D Status across BMI Classes: An Observational Prospective Cohort Study. Nutrients. 2019 Dec;11(12):3034.
- Tønnesen R, Hovind PH, Jensen LT, Schwarz P. Determinants of vitamin D status in young adults: influence of lifestyle, sociodemographic and anthropometric factors. BMC Public Health. 2016 May 11;16(1):385.
- Lange NE, Sparrow D, Vokonas P, Litonjua AA. Vitamin D Deficiency, Smoking, and Lung Function in the Normative Aging Study. Am J Respir Crit Care Med. 2012 Oct 1;186(7):616–21.
- Kassi EN, Stavropoulos S, Kokkoris P, Galanos A, Moutsatsou P, Dimas C, et al. Smoking is a significant determinant of low serum vitamin D in young and middle-aged healthy males. Hormones (Athens). 2015 Jun;14(2):245–50.
- Coppeta L, Papa F, Magrini A. Are Shiftwork and Indoor Work Related to D3 Vitamin Deficiency? A Systematic Review of Current Evidences. J Environ Public Health. 2018 Sep 10;2018:8468742.
- Williams S, Malatesta K, Norris K. Vitamin D and Chronic Kidney Disease. Ethn Dis. 2009;19(4 Suppl 5):S5-8–11.
- Ham M, Longhi MS, Lahiff C, Cheifetz A, Robson S, Moss AC. Vitamin D Levels in Adults with Crohn’s Disease Are Responsive to Disease Activity and Treatment. Inflamm Bowel Dis. 2014 May;20(5):856–60.
- Gröber U, Kisters K. Influence of drugs on vitamin D and calcium metabolism. Dermatoendocrinol. 2012 Apr 1;4(2):158–66.